Video Histogram
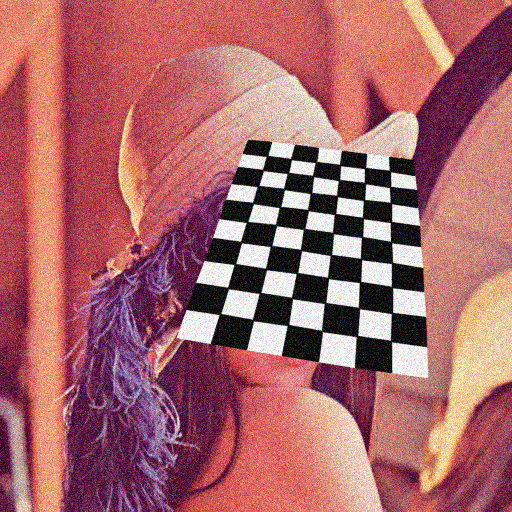
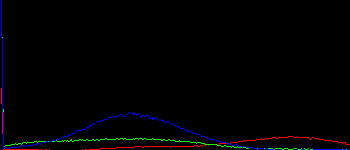
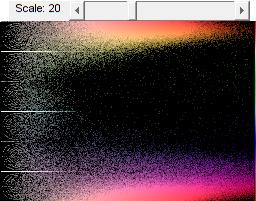
Demo to show live histogram of video, both 1D histograms of RGB channels and 2D histogram of Hue-Saturation.
Sources:
function varargout = color_histogram_demo_gui(varargin)
    % setup video source
    vid = createVideoCapture([], 'chess');
    pause(0.5);
    assert(vid.isOpened());

    % build and initialize GUI
    opts = default_options();
    h = buildGUI(vid, opts);
    if nargout > 0, varargout{1} = h; end

    % main loop: while UI still open, keep processing frames
    while all(ishghandle(h.img)) && vid.isOpened()
        % grab next frame
        frame = vid.read();
        if isempty(frame), break; end

        % compute 2D Hue/Saturation histogram and 1D R/G/B histogram
        opts.scale = get(h.slid, 'Value');  % current slider value
        out2 = hist2D_HSV(frame, opts);
        out1 = hist1D_RGB(frame, opts);

        % show results
        set(h.lbl, 'String',sprintf('Scale: %.0f',opts.scale));
        set(h.img(1), 'CData',frame);
        set(h.img(2), 'CData',out2);
        set(h.img(3), 'CData',out1);
        drawnow;
    end
    vid.release();
end

function opts = default_options()
    %DEFAULT_OPTIONS  Create structure of options

    opts = struct();

    % hue/saturation histogram params (hue: 0-179 degrees, saturation: 0-255)
    opts.hlims = [0 180];
    opts.slims = [0 256];
    opts.hbins = 180;
    opts.sbins = 256;

    % R/G/B histograms params (R/G/B: 0-255)
    opts.clims = [0 256];
    opts.cbins = 256;
    opts.sz = [150, 350];

    % build HSV map, used to color the histogram
    [H,S,V] = ndgrid((1:opts.hbins)-1, (1:opts.sbins)-1, 255);
    RGB = cv.cvtColor(uint8(cat(3,H,S,V)), 'HSV2RGB');
    opts.map = double(RGB)./255;
    opts.scale = 20;
end

function out = hist2D_HSV(img, opts)
    %HIST1D_HSV  Calculate H-S 2D histogram

    % downscale for faster computation
    if false
        img = cv.pyrDown(img);
    end

    % convert RGB to HSV colorspace
    hsv = cv.cvtColor(img, 'RGB2HSV');

    % blacken dark pixels
    mask = hsv(:,:,3) < 20;  % V between 0 and 180
    mask = repmat(mask, [1 1 3]);
    hsv(mask) = 0;

    % calculate 2D histogram over H and S channels
    H = cv.calcHist(hsv, {opts.hlims, opts.slims}, 'Channels',[0 1], ...
        'Uniform',true, 'HistSize',[opts.hbins opts.sbins]);

    % scale histogram for better visualization
    H = log(H) * (opts.scale/64);  % log-transform and scale
    H = min(max(H, 0), 1);         % clip to [0,1] range

    % color the histogram using the HSV map (both in 0-1 range)
    out = bsxfun(@times, H, opts.map);
end

function out = hist1D_RGB(img, opts)
    %HIST1D_HSV  Calculate RGB 1D histograms

    % output image
    out = zeros([opts.sz 3], 'uint8');

    % x-coords of histogram line points scaled to fit image horizontally
    % (origin is top-right corner)
    x = opts.sz(2) * (1:opts.cbins) / opts.cbins;

    % for each channel in R,G,B
    clrs = [255 0 0; 0 255 0; 0 0 255];
    for i=1:3
        % compute 1D histogram for current channel
        H = cv.calcHist(img(:,:,i), {opts.clims}, ...
            'HistSize',opts.cbins, 'Uniform',true);

        % normalize counts to [0,opts.sz(1)] to fit image vertically
        if true
            H = cv.normalize(H, 'NormType','MinMax', 'Alpha',0, 'Beta',opts.sz(1));
        else
            H = opts.sz(1) * (H - min(H)) / (max(H) - min(H));
        end

        % draw histogram as line
        out = cv.polylines(out, [x(:), opts.sz(1) - H(:)], ...
            'Color',clrs(i,:), 'Closed',false);
    end
end

function onType(~,e,h)
    %ONTYPE  Event handler for key press on figure

    switch e.Key
        case {'q', 'escape'}
            close(h.fig);
    end
end

function h = buildGUI(vid, opts)
    %BUILDGUI  Construct the GUI

    % structure of handles
    h = struct();

    % video feed: figure, axis, image
    if true
        sz = [vid.get('FrameHeight'), vid.get('FrameWidth')];
        img = zeros([sz 3], 'uint8');
    else
        img = vid.read();
        assert(~isempty(img));
        sz = size(img);
    end
    h.fig(1) = figure('Name','Camera', 'Menubar','none', 'Resize','on', ...
        'Position',[100 200 sz(2) sz(1)]);
    h.ax(1) = axes('Parent',h.fig(1), 'Units','normalized', 'Position',[0 0 1 1]);
    h.img(1) = imshow(img, 'Parent',h.ax(1));

    % Hue/Saturation 2D histogram: figure, axis, image, slider, label
    img = zeros(size(opts.map), 'double');
    h.fig(2) = figure('Name','Hue/Saturation Hist', 'Menubar','none', 'Resize','off', ...
        'Position',[100+sz(2)+50 200 opts.sbins opts.hbins+21]);
    h.ax(2) = axes('Parent',h.fig(2), 'Units','pixels', ...
        'Position',[1 1 opts.sbins opts.hbins]);
    h.img(2) = imshow(img, 'Parent',h.ax(2));
    h.slid = uicontrol('Parent',h.fig(2), 'Style','slider', ...
        'Position',[70 opts.hbins+1 opts.sbins-75 20], ...
        'Value',opts.scale, 'Min',1, 'Max',64, 'SliderStep',[1 5]./64);
    h.lbl = uicontrol('Parent',h.fig(2), 'Style','text', ...
        'BackgroundColor',get(h.fig(1), 'Color'), ...
        'String',sprintf('Scale: %.0f',opts.scale), ...
        'Position',[10 opts.hbins+1 60 20]);

    % RGB histogram (three 1D hist): figure, axis, image
    img = zeros([opts.sz 3], 'uint8');
    h.fig(3) = figure('Name', 'R/G/B Hist', 'Menubar','none', 'Resize','on', ...
        'Position',[100+sz(2)+50+opts.sbins+50 200 opts.sz(2) opts.sz(1)]);
    h.ax(3) = axes('Parent',h.fig(3), 'Units','normalized', 'Position',[0 0 1 1]);
    h.img(3) = imshow(img, 'Parent',h.ax(3));

    % hook event handlers
    set(h.fig, 'WindowKeyPressFcn',{@onType,h}, ...
        'CloseRequestFcn',@(~,~) delete(h.fig), ...
        'Interruptible','off', 'BusyAction','cancel');
end


