Contours demo
The example below shows how to retrieve connected components from a binary image and label them.
Contents
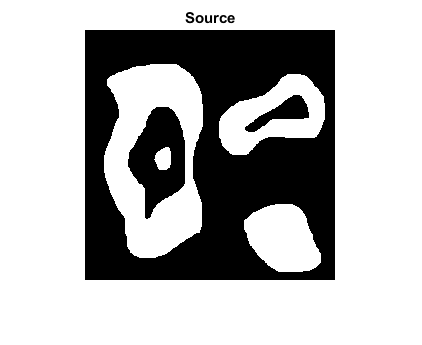
Image
load binary image (black-and-white, logical)
bw = imread(fullfile(mexopencv.root(),'test','bw.png'));
imshow(bw), title('Source')

Connected Components
[contours, hierarchy] = cv.findContours(bw, ...
    'Mode','CComp', 'Method','Simple');
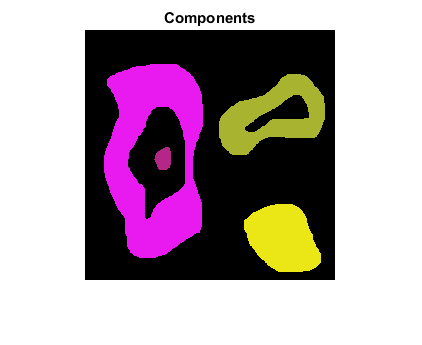
iterate through all the top-level contours, draw each connected component with its own random color
dst = zeros([size(bw) 3], 'uint8');
idx = 0;
while idx >= 0
    clr = randi([0 255], [1 3], 'uint8');
    dst = cv.drawContours(dst, contours, ...
        'Hierarchy',hierarchy, 'ContourIdx',idx, ...
        'Color',clr, 'Thickness','Filled', 'LineType',8);
    idx = hierarchy{idx+1}(1);
end
show result
imshow(dst), title('Components')
Connected Components
a different way to perform connected components labeling
[labels, num, stats, centroids] = cv.connectedComponents(bw);
convert labels to one-based floating-point indices, background being label 1
labels = double(labels) + 1;
if mexopencv.require('stats')
	tabulate(labels(:))
end
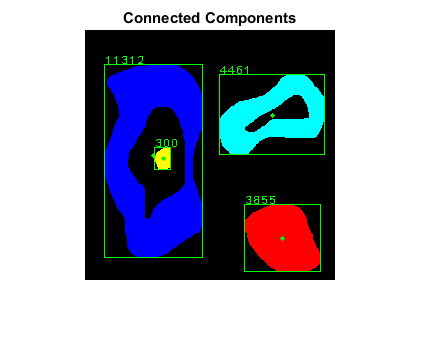
  Value    Count   Percent
      1    42572     68.12%
      2    11312     18.10%
      3     4461      7.14%
      4      300      0.48%
      5     3855      6.17%
color-code labels
clr = [0 0 0; jet(num-1)];  % black for the background
out = uint8(255 * ind2rgb(labels, clr));
draw bounding box, centroid, and area of each component
opts = {'Color',[0 255 0]};
for i=2:num   % skip first background label
    out = cv.rectangle(out, stats(i,1:4), opts{:});
    out = cv.circle(out, centroids(i,:), 2, 'Thickness','Filled', opts{:});
    out = cv.putText(out, sprintf('%d',stats(i,5)), stats(i,1:2), ...
        'FontFace','HersheyPlain', 'FontScale',0.8, opts{:});
end
show result
figure, imshow(out), title('Connected Components')