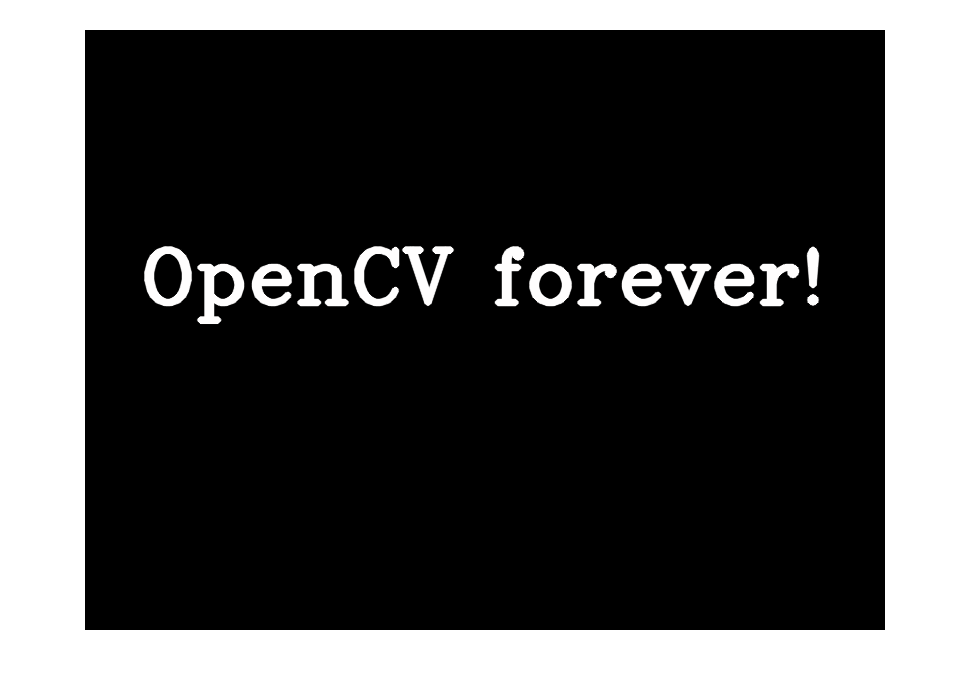
Demonstration of drawing functions
This program demonstrates OpenCV drawing and text output functions.
Sources:
- https://github.com/opencv/opencv/blob/3.2.0/samples/cpp/drawing.cpp
- https://docs.opencv.org/3.2.0/df/d61/tutorial_random_generator_and_text.html
- https://docs.opencv.org/3.2.0/dc/da5/tutorial_py_drawing_functions.html
- https://github.com/opencv/opencv/blob/3.2.0/samples/cpp/tutorial_code/core/Matrix/Drawing_2.cpp
Contents
Options
DELAY = 5e-3;                  % pause delay (sec)
NUMBER = 100;                  % number of repeats
lineType = {'LineType','AA'};  % change to 8 to see non-antialiased graphics
W = 800; H = 600;              % width/height of output image
img = zeros(H,W,3,'uint8');

% rng
xlims = fix([-W/2 W*3/2]);
ylims = fix([-H/2 H*3/2]);
clr = @() randi([0 255], [1 3], 'uint8');
markers = '+x*ds^v';
marker = @() markers(randi([1 numel(markers)]));

% prepare plot
hImg = imshow(img);
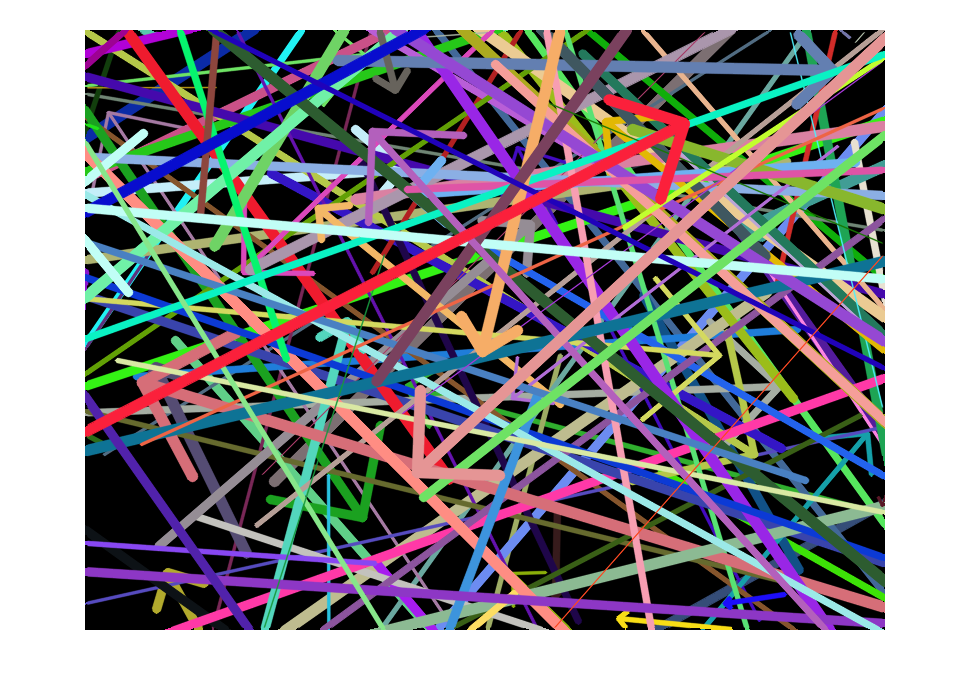
Lines
for i=1:NUMBER*2
    pt1 = [randi(xlims) randi(ylims)];
    pt2 = [randi(xlims) randi(ylims)];
    thick = randi([1 10]);

    if rand < 0.5
        img = cv.line(img, pt1, pt2, ...
            'Color',clr(), 'Thickness',thick, lineType{:});
    else
        img = cv.arrowedLine(img, pt1, pt2, ...
            'Color',clr(), 'Thickness',thick, lineType{:});
    end

    set(hImg, 'CData',img);
    pause(DELAY);
end
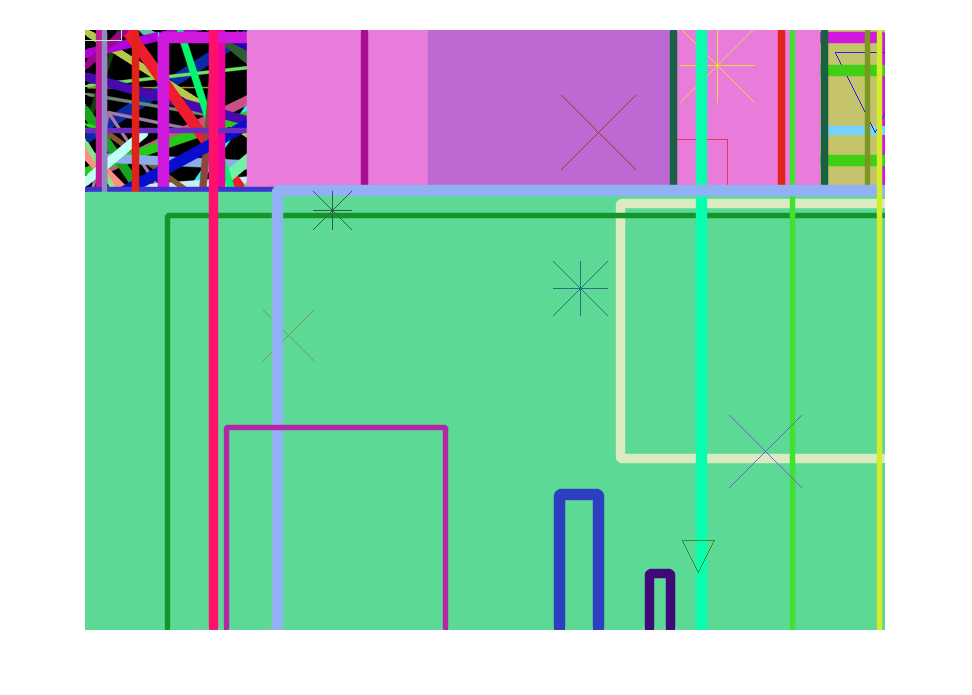
Rectangles
for i=1:NUMBER*2
    pt1 = [randi(xlims) randi(ylims)];
    pt2 = [randi(xlims) randi(ylims)];
    thick = max(randi([-3 10]), -1);

    if rand < 0.5
        img = cv.rectangle(img, pt1, pt2, ...
            'Color',clr(), 'Thickness',thick, lineType{:});
    else
        img = cv.drawMarker(img, pt1, ...
            'Color',clr(), 'MarkerType',marker(), 'MarkerSize',randi([30 80]));
    end

    set(hImg, 'CData',img);
    pause(DELAY);
end
Ellipses
for i=1:NUMBER
    center = [randi(xlims) randi(ylims)];
    ax = randi([0 200], [1 2]);
    a = randi([0 180]);
    thick = randi([-1 9]);

    img = cv.ellipse(img, center, ax, ...
        'Angle',a, 'StartAngle',a-100, 'EndAngle',a+200, ...
        'Color',clr(), 'Thickness',thick, lineType{:});

    set(hImg, 'CData',img);
    pause(DELAY);
end

Polygons
for i=1:NUMBER
    pts = arrayfun(@(~) [randi(xlims, [3 1]) randi(ylims, [3 1])], 1:2, ...
        'Uniform',false);
    thick = randi([1 10]);

    img = cv.polylines(img, pts, ...
        'Closed',true, 'Color',clr(), 'Thickness',thick, lineType{:});

    set(hImg, 'CData',img);
    pause(DELAY);
end
Filled Polygons
for i=1:NUMBER
    pts = arrayfun(@(~) [randi(xlims, [3 1]) randi(ylims, [3 1])], 1:2, ...
        'Uniform',false);

    img = cv.fillPoly(img, pts, ...
        'Color',clr(), lineType{:});

    set(hImg, 'CData',img);
    pause(DELAY);
end
Circles
for i=1:NUMBER
    center = [randi(xlims) randi(ylims)];
    radius = randi([0 300]);
    thick = randi([-1 9]);

    img = cv.circle(img, center, radius, ...
        'Color',clr(), 'Thickness',thick, lineType{:});

    set(hImg, 'CData',img);
    pause(DELAY);
end
Text
str = 'Testing text rendering';
fonts = strcat('Hershey', {'Simplex', 'Plain', 'Duplex', 'Complex', ...
    'Triplex', 'ComplexSmall', 'ScriptSimplex', 'ScriptComplex'});
for i=1:NUMBER
    pt = [randi(xlims) randi(ylims)];
    font = randi([1 numel(fonts)]);
    scale = randi([0 100])*0.05 + 0.1;
    thick = randi([1 10]);

    img = cv.putText(img, str, pt, ...
        'FontFace',fonts{font}, 'FontScale',scale, ...
        'Color',clr(), 'Thickness',thick, lineType{:});

    set(hImg, 'CData',img);
    pause(DELAY);
end
Text Animation
str = 'OpenCV forever!';
opts = {'FontFace','HersheyComplex', 'FontScale',2.5, 'Thickness',5};
textsize = cv.getTextSize(str, opts{:});
pt = fix(([W H] - textsize)/2);
for i=0:2:254
    img = cv.putText(img - i, str, pt, ...
        'Color',[255 i i], opts{:}, lineType{:});

    set(hImg, 'CData',img);
    pause(DELAY);
end
