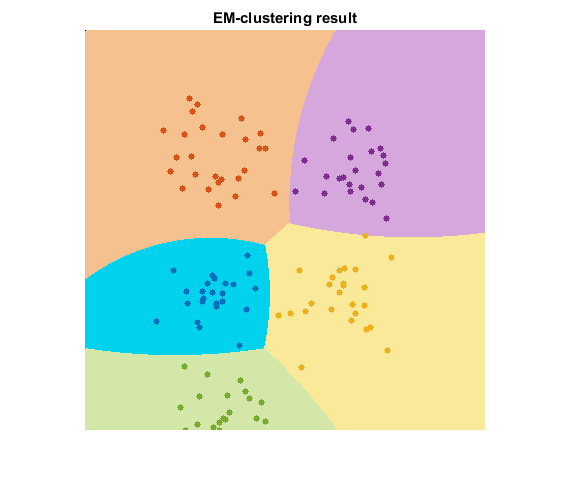
EM Clustering
Sources:
Contents
Options
K = 5;             % number of clusters
N = 25;            % number of samples per cluster
W = 400; H = 400;  % width/height of output image containing 2D points

% some colors for drawing
clrFG = lines(K);
clrBG = brighten(clrFG, 0.75);
Data
generate the training samples
samples = cell(K,1);
for i=1:K
    K1 = fix(sqrt(K));
    mu = ([mod(i-1,K1), fix((i-1)/K1)] + 1) * H / (K1+1);
    sig = [30 30];
    samples{i} = bsxfun(@plus, bsxfun(@times, randn([N 2]), sig), mu);
end
samples = single(cat(1, samples{:}));  % 2D points (nsamples-by-2)
true labels (nsamples-by-1)
if mexopencv.isOctave()
    %HACK: http://savannah.gnu.org/bugs/?45497
    groups = int32(repelems(1:K, [1:K; repmat(N,1,K)]))';
else
    groups = int32(repelem((1:K)', N));
end
EM Cluster
cluster the data
em = cv.EM();
em.ClustersNumber = K;
em.CovarianceMatrixType = 'Spherical';
em.TermCriteria.maxCount = 300;
em.TermCriteria.epsilon = 0.1;

[~,labels] = em.trainEM(samples);
labels = int32(labels) + 1;  % convert 0-based to 1-based indices
Plot
canvas to draw 2D points
img = zeros([H W 3], 'uint8');classify every image pixel
[X,Y] = meshgrid(1:W, 1:H);
XY = single([X(:) Y(:)]);

[~,response] = em.predict2(XY);
response = int32(response) + 1;  % convert 0-based to 1-based indices
draw the clustered pixels
for i=1:K
    idx = (response == i);
    if ~any(idx), continue; end
    img = cv.circle(img, XY(idx,:), 1, ...
        'Color',uint8(clrBG(i,:)*255), 'Thickness','Filled');
end
draw the clustered samples
for i=1:size(samples,1)
    img = cv.circle(img, round(samples(i,:)), 3, ...
        'Color',uint8(clrFG(labels(i),:)*255), 'Thickness','Filled');
end
display the result
imshow(img)
title('EM-clustering result')
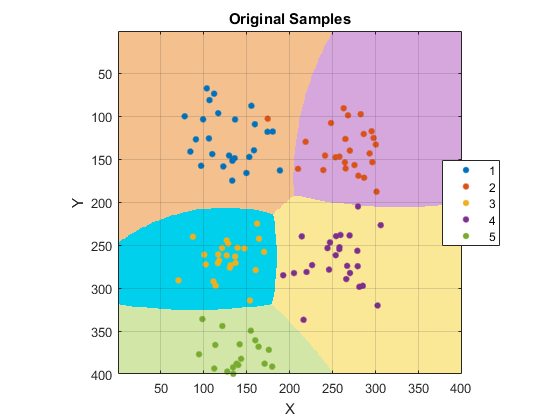
display the original sample labels vs. clusters
figure
image([1 W], [1 H], reshape(double(response), [H W]))
colormap(clrBG)
hold on
if mexopencv.isOctave()
    %HACK: GSCATTER not implemented in Octave
    scatter(samples(:,1), samples(:,2), [], double(groups))
else
    gscatter(samples(:,1), samples(:,2), groups, clrFG)
end
hold off
axis equal ij, axis([1 W 1 H]), grid on
title('Original Samples'), xlabel('X'), ylabel('Y')
