Robust Line Fitting
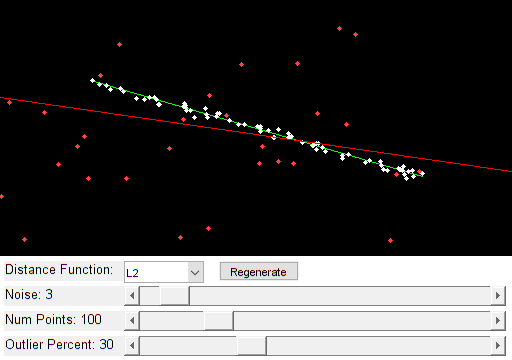
Example of using cv.fitLine function for fitting 2D line to points in presence of outliers.
Switch between the different M-estimator functions and see, how well the robust functions fit the line even in case of ~50% of outliers.
Sources:
function varargout = fitline_demo_gui()
    % create the UI
    h = buildGUI();
    if nargout > 0, varargout{1} = h; end
end

function pts = sample_line(p1, p2, num, noise)
    %SAMPLE_LINE  Sample points from line segment
    %
    %     pts = sample_line(p1, p2, num)
    %     pts = sample_line(p1, p2, num, noise)
    %
    % ## Input
    % * __p1__ first line point
    % * __p2__ second line point
    % * __num__ number of points to sample
    % * __noise__ gaussian noise added, default 0
    %
    % ## Output
    % * __pts__ points matrix num-by-2
    %

    if nargin < 4, noise = 0; end

    t = rand(num,1);
    pts = bsxfun(@plus, p1, bsxfun(@times, p2 - p1, t));
    pts = pts + randn(num,2) * noise;
end

function onChange(~,~,h)
    %ONCHANGE  Event handler for UI controls

    % retrieve current values from UI controls
    alg = get(h.pop, 'Value');
    algs = get(h.pop, 'String');
    r = round(get(h.slid(1), 'Value'));
    numPoints = round(get(h.slid(2), 'Value'));
    noise = round(get(h.slid(3), 'Value'));
    set(h.txt(1), 'String',sprintf('Outlier Percent: %d',r));
    set(h.txt(2), 'String',sprintf('Num Points: %d',numPoints));
    set(h.txt(3), 'String',sprintf('Noise: %d',noise));

    numOutliers = round(numPoints * r/100);
    dist_func = algs{alg};

    % we need at least two points to fit a line
    if numPoints < 2, return; end

    % draw ground-truth line segment from which we sample points
    p0 = [90, 80];
    p1 = h.sz([2 1]) - p0;

    % sample points from line (with some noise)
    line_points = sample_line(p0, p1, numPoints-numOutliers, noise);

    % create outlier points
    outliers = bsxfun(@times, rand(numOutliers,2), h.sz([2 1]));

    % fit line on all points
    lin = cv.fitLine([line_points; outliers], 'DistType',dist_func);

    % draw points and lines
    img = zeros([h.sz 3], 'uint8');
    img = cv.line(img, p0, p1, 'Color',[0 255 0]);
    img = cv.circle(img, line_points, 2, ...
        'Color',[255 255 255], 'Thickness','Filled');
    img = cv.circle(img, outliers, 2, ...
        'Color',[255 64 64], 'Thickness','Filled');
    img = cv.line(img, ...
        lin(3:4) - lin(1:2)*h.sz(2), ...
        lin(3:4) + lin(1:2)*h.sz(2), 'Color',[255 0 0]);

    % show result
    set(h.img, 'CData',img);
    drawnow;
end

function h = buildGUI()
    %BUILDGUI  Creates the UI

    % parameters
    sz = [256 512];
    img = zeros([sz 3], 'uint8');

    % build the user interface (no resizing to keep it simple)
    h = struct();
    h.sz = sz;
    h.fig = figure('Name','Fit Line Demo', ...
        'NumberTitle','off', 'Menubar','none', 'Resize','off', ...
        'Position',[200 200 sz(2) sz(1)+105-1]);
    if ~mexopencv.isOctave()
        %HACK: not implemented in Octave
        movegui(h.fig, 'center');
    end
    h.ax = axes('Parent',h.fig, 'Units','pixels', 'Position',[1 105 sz(2) sz(1)]);
    if ~mexopencv.isOctave()
        h.img = imshow(img, 'Parent',h.ax);
    else
        %HACK: https://savannah.gnu.org/bugs/index.php?45473
        axes(h.ax);
        h.img = imshow(img);
    end
    h.txt(1) = uicontrol('Parent',h.fig, 'Style','text', ...
        'FontSize',10, 'HorizontalAlignment','left', ...
        'Position',[5 5 120 20], 'String','Outlier Percent:');
    h.txt(2) = uicontrol('Parent',h.fig, 'Style','text', ...
        'FontSize',10, 'HorizontalAlignment','left', ...
        'Position',[5 30 120 20], 'String','Num Points:');
    h.txt(3) = uicontrol('Parent',h.fig, 'Style','text', ...
        'FontSize',10, 'HorizontalAlignment','left', ...
        'Position',[5 55 120 20], 'String','Noise:');
    h.txt(4) = uicontrol('Parent',h.fig, 'Style','text', ...
        'FontSize',10, 'HorizontalAlignment','left', ...
        'Position',[5 80 120 20], 'String','Distance Function:');
    h.slid(1) = uicontrol('Parent',h.fig, 'Style','slider', ...
        'Value',30, 'Min',0, 'Max',100, 'SliderStep',[1 10]./(100-0), ...
        'Position',[125 5 sz(2)-125-5 20]);
    h.slid(2) = uicontrol('Parent',h.fig, 'Style','slider', ...
        'Value',100, 'Min',2, 'Max',500, 'SliderStep',[1 50]./(500-2), ...
        'Position',[125 30 sz(2)-125-5 20]);
    h.slid(3) = uicontrol('Parent',h.fig, 'Style','slider', ...
        'Value',3, 'Min',0, 'Max',50, 'SliderStep',[1 5]./(50-0), ...
        'Position',[125 55 sz(2)-125-5 20]);
    h.pop = uicontrol('Parent',h.fig, 'Style','popupmenu', ...
        'Position',[125 80 80 20], ...
        'String',{'L2', 'L1', 'L12', 'Fair', 'Welsch', 'Huber'});
    h.btn = uicontrol('Parent',h.fig, 'Style','pushbutton', ...
        'Position',[220 80 80 20], 'String','Regenerate');

    % hook event handlers, and trigger default start
    set([h.slid, h.pop, h.btn], 'Callback',{@onChange,h}, ...
        'Interruptible','off', 'BusyAction','cancel');
    onChange([],[],h);
end
