Flood-Fill demo
Demonstrates how to use cv.floodFill.
Contents
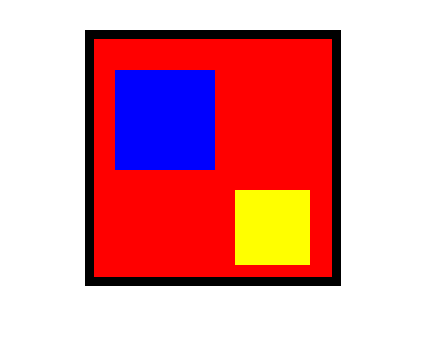
Input image and mask
some color image with defined connected components (as squares)
img = zeros([256,256,3],'uint8');
img(:,:,1) = 255;
img = cv.rectangle(img, [0 0], [255 255], 'Thickness',15);
img = cv.rectangle(img, [30 40 100 100], 'Thickness','Filled', 'Color',[0 0 255]);
img = cv.rectangle(img, [150 160 75 75], 'Thickness','Filled', 'Color',[255 255 0]);

imshow(img)
seed starting point
seed = [200 100];
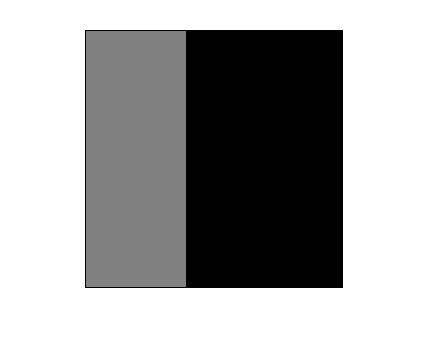
mask: zeros allowed to change, non-zeros are not changed (must be 2 pixels taller/wider)
mask = zeros(size(img,1), size(img,2), 'uint8');
mask(:,1:100) = 128;
mask = cv.copyMakeBorder(mask, [1 1 1 1], 'BorderType','Constant', 'Value',0);

imshow(mask)
Alternative images
if false
    img = imread(fullfile(mexopencv.root(),'test','pic3.png'));
    seed = [200 200];
    mask = zeros(size(img,1)+2, size(img,2)+2, 'uint8');
    mask(:,290:end) = 128;
elseif false
    img = imread(fullfile(mexopencv.root(),'test','pic5.png'));
    seed = [300 200];
    mask = zeros(size(img,1)+2, size(img,2)+2, 'uint8');
    mask(230:end,:) = 128;
end
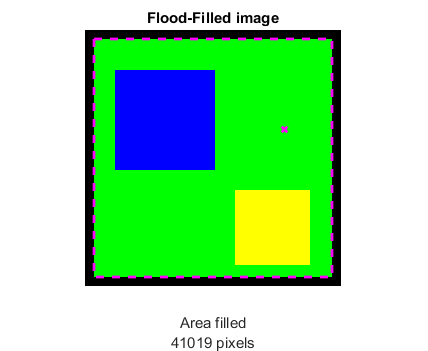
Flood-Filling without masking
we specify 8-connectivity, a floating range, and max lower/uppder diffs
[out,r1,a1] = cv.floodFill(img, seed, [0 255 0], ...
    'Connectivity',8, 'FixedRange',false, ...
    'LoDiff',[0 0 0]+0, 'UpDiff',[0 0 0]+0);
show output image, along with seed point and bounding box
imshow(out), title('Flood-Filled image')
line(seed(1), seed(2), 'Color','m', 'Marker','x', ...
    'LineStyle','none', 'LineWidth',2)
rectangle('Position',r1+[0.5 0.5 0 0], 'EdgeColor','m', ...
    'LineStyle','--', 'LineWidth',2);
xlabel(sprintf('Area filled\n%d pixels',a1))
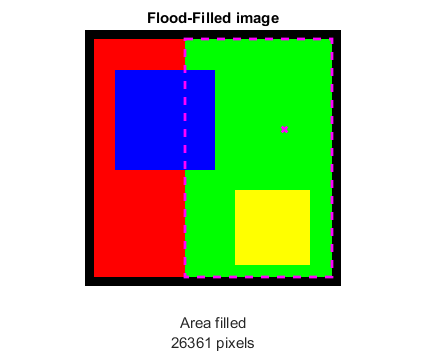
Flood-Filling with masking
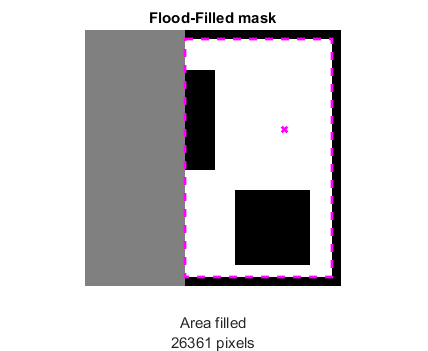
we fill both image and mask, and update mask with a fill value of 255
[out2,r2,a2,mask2] = cv.floodFill(img, seed, [0 255 0], ...
    'Mask',mask, 'MaskOnly',false, 'MaskFillValue',255);

% trim padded border
mask2 = mask2(2:end-1,2:end-1);
show updated mask, along with seed point and bounding box
imshow(mask2), title('Flood-Filled mask')
line(seed(1), seed(2), 'Color','m', 'Marker','x', ...
    'LineStyle','none', 'LineWidth',2)
rectangle('Position',r2+[0.5 0.5 0 0], 'EdgeColor','m', ...
    'LineStyle','--', 'LineWidth',2);
xlabel(sprintf('Area filled\n%d pixels',a2))
show filled image, along with seed point and bounding box
imshow(out2), title('Flood-Filled image')
line(seed(1), seed(2), 'Color','m', 'Marker','x', ...
    'LineStyle','none', 'LineWidth',2)
rectangle('Position',r2+[0.5 0.5 0 0], 'EdgeColor','m', ...
    'LineStyle','--', 'LineWidth',2);
xlabel(sprintf('Area filled\n%d pixels',a2))
