Contents
Gaussian Mixture Model (GMM)
Demonstrates EM clustering, and also compares againt K-means clustering.
Sources:
function gaussian_mix_demo()Data
sample 2D points from a mixture distribution of K bivariate Gaussians
    K = 5;
    sz = 512;
    [pts, labels, mus, sigmas] = make_gaussian_mixture(K, sz);
    whos pts labels mus sigmas
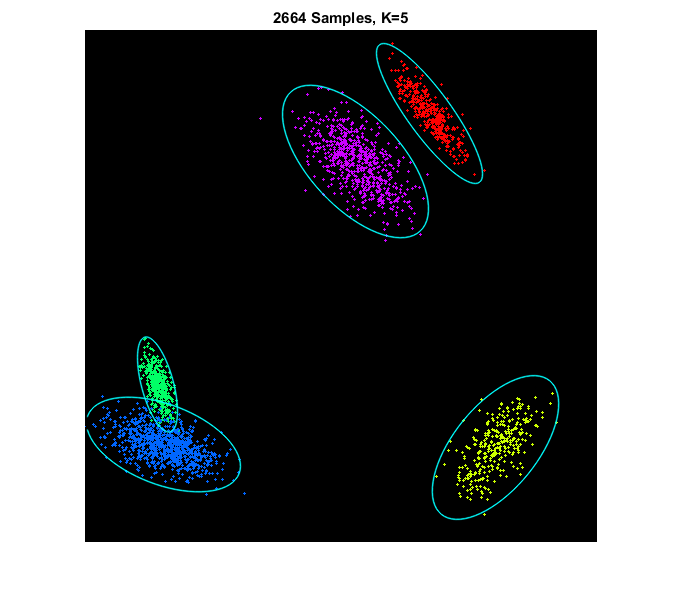
draw points (color-coded) with the ground-truth mixtures
    clr = uint8(hsv(K) * 255);
    clr(:,4) = 0;
    img = zeros([sz sz 3], 'uint8');
    img0 = cv.circle(img, pts, 1, 'Colors',clr(labels,:), 'Thickness','Filled');
    for k=1:K
        img0 = draw_gaussian(img0, mus(k,:), sigmas{k}, [0 255 255]);
    end
    imshow(img0), title(sprintf('%d Samples, K=%d', numel(labels), K))
EM
cluster using EM by fitting a Gaussian mixture model
    em = cv.EM();
    em.ClustersNumber = K;
    em.CovarianceMatrixType = 'Generic';
    tic
    [~,L] = em.trainEM(pts);
    toc
Elapsed time is 4.042468 seconds.
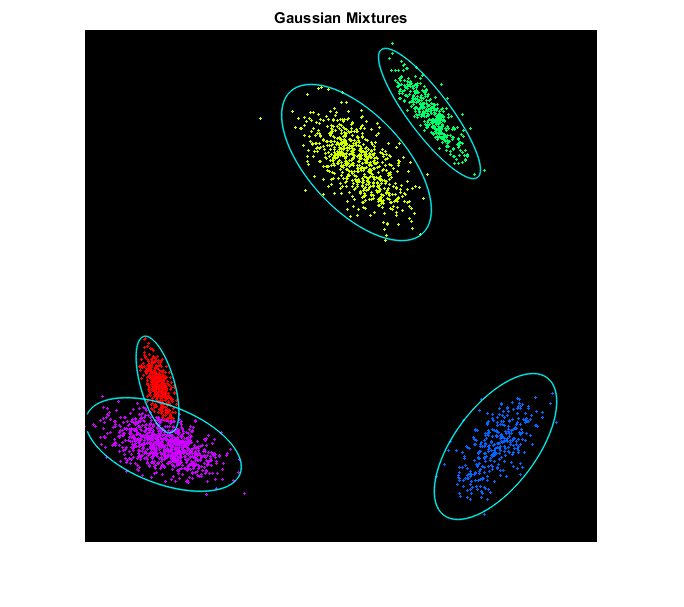
draw clustered points along with the estimated mixture model
    means = em.getMeans();
    covs = em.getCovs();
    img1 = cv.circle(img, pts, 1, 'Colors',clr(L+1,:), 'Thickness','Filled');
    for k=1:K
        img1 = draw_gaussian(img1, means(k,:), covs{k}, [0 255 255]);
    end
    figure, imshow(img1), title('Gaussian Mixtures')
Kmeans
cluster using Kmeans
    crit = struct('type','Count+EPS', 'maxCount',30, 'epsilon',0.1);
    L = cv.kmeans(pts, K, 'Criteria',crit, 'Attempts',10);
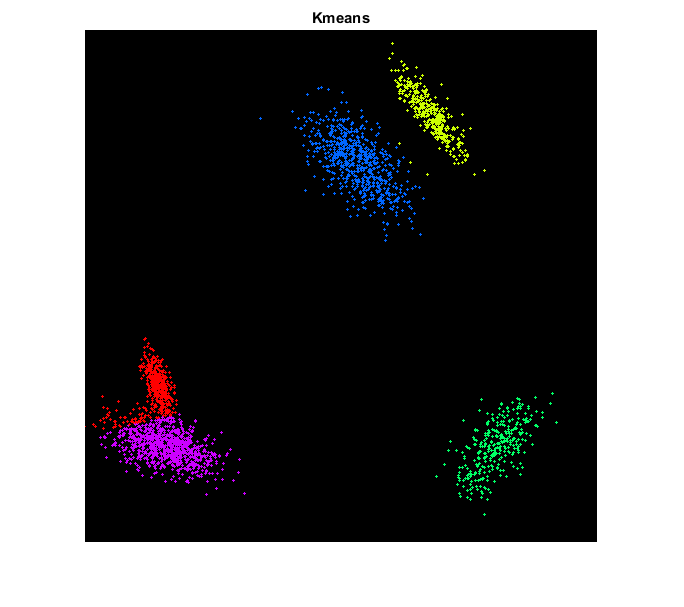
draw points color-coded by assigned label
    img2 = cv.circle(img, pts, 1, 'Colors',clr(L+1,:), 'Thickness','Filled');
    figure, imshow(img2), title('Kmeans')

endHelper functions
function [pts, labels, mus, sigmas] = make_gaussian_mixture(K, sz)
    %MAKE_GAUSSIAN_MIXTURE  Random points from Gaussian mixture distribution
    %
    %     [pts, labels, mus, sigmas] = make_gaussian_mixture(K, sz)
    %
    % ## Input
    % * __K__ number of components
    % * __sz__ image size, determines 2D points domain
    %
    % ## Output
    % * __pts__ matrix of 2D points
    % * __labels__ vector of corresponding component indices
    % * __mus__ K-by-2 mean of each component
    % * __sigmas__ cell array of length K, covariance of each component
    %
    % See also: gmdistribution.random
    %

    mus = zeros(K,2);
    sigmas = cell(K,1);
    pts = cell(K,1);
    labels = cell(K,1);
    for k=1:K
        mus(k,:) = (rand(1,2)*0.8 + 0.1) * sz;
        a = (rand(2,2) - 0.5) * sz * 0.1;
        sigmas{k} = (a.' * a) + sz*0.05*eye(2);
        n = 100 + randi([0 900]);
        pts{k} = my_mvnrnd(mus(k,:), sigmas{k}, n);
        labels{k} = k * ones(size(pts{k},1),1);
    end
    pts = single(cat(1, pts{:}));
    labels = int32(cat(1, labels{:}));
end
function X = my_mvnrnd(mu, sigma, num)
    %MY_MVNRND  Random points from Gaussian distribution
    %
    %     X = my_mvnrnd(mu, sigma, num)
    %
    % ## Input
    % * __mu__ 1x2 mean vector
    % * __sigma__ 2x2 covariance matrix
    % * __num__ number of points to generate
    %
    % ## Output
    % * __X__ matrix of 2D points, num-by-2
    %
    % See also: mvnrnd, randn
    %

    if mexopencv.require('stats')
        X = mvnrnd(mu, sigma, num);
    else
        X = bsxfun(@plus, randn(num,numel(mu)) * cholcov(sigma), mu);
    end
end
  Name           Size            Bytes  Class     Attributes

  labels      2664x1             10656  int32
  mus            5x2                80  double
  pts         2664x2             21312  single
  sigmas         5x1               720  cell
function img = draw_gaussian(img, mu, sigma, clr)
    %DRAW_GAUSSIAN  Draw a bivariate Gaussian
    %
    %     img = draw_gaussian(img, mu, sigma, clr)
    %
    % ## Input
    % * __img__ input image on which to draw
    % * __mu__ 1x2 mean vector
    % * __sigma__ 2x2 covariance matrix
    % * __clr__ color
    %
    % ## Output
    % * __img__ output image
    %
    % Represent a 2D Gaussian with an ellipse where:
    %
    % * its mean is the center of the ellipse
    % * its covariance matrix eigenvector corresponding to largest eigenvalue
    %   is the direction of the ellipse
    % * its (scaled) eigenvalues are the major/minor axis lengths of the
    %   ellipse
    %

    [w,u,~] = cv.SVD.Compute(sigma);
    ang = atan2(u(2,1), u(1,1)) * (180/pi);
    s = sqrt(w)*3;
    img = cv.ellipse(img, mu, s, 'Angle',ang, 'Color',clr, 'LineType','AA');
end