Creating Bounding boxes and circles for contours
Demo code to find contours in an image.
In this sample you will learn how to:
- use the OpenCV function cv.boundingRect
- use the OpenCV function cv.minEnclosingCircle
Sources:
Contents
Input
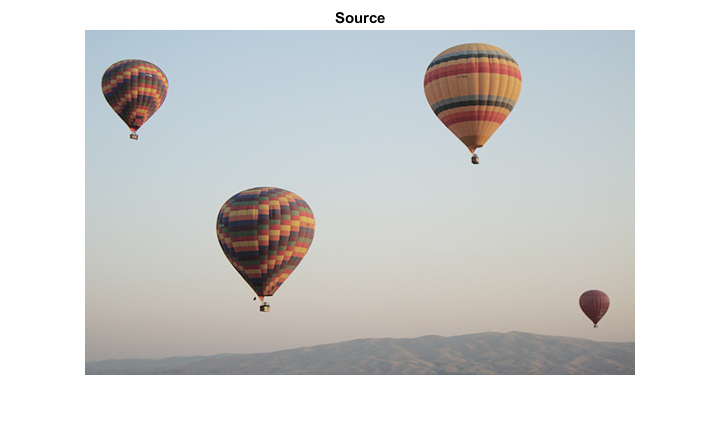
% Load source image
src = imread(fullfile(mexopencv.root(),'test','balloon.jpg'));

% Convert image to gray and blur it to get rid of the noise
src_gray = cv.cvtColor(src, 'RGB2GRAY');
src_gray = cv.blur(src_gray, 'KSize',[3 3]);

% Create figure
imshow(src), title('Source')

Edges + Contours
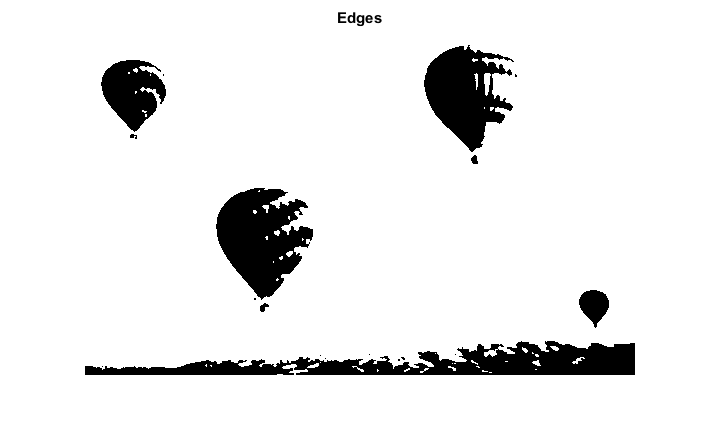
% Detect edges using Threshold
thresh = 134;
threshold_output = cv.threshold(src_gray, thresh, ...
    'MaxValue',255, 'Type','Binary');
imshow(threshold_output), title('Edges')

% Find contours
[contours, hierarchy] = cv.findContours(threshold_output, ...
    'Mode','Tree', 'Method','Simple');

Bounding rectangles and enclosing circles
Approximate contours to polygons + get bounding rects and circles
contours_poly = cell(size(contours));
boundRect = cell(size(contours));
center = cell(size(contours));
radius = zeros(size(contours));
for i=1:numel(contours)
    % approximate to polygon with accuracy +/- 3 where curve must me closed
    contours_poly{i} = cv.approxPolyDP(contours{i}, ...
        'Epsilon',3, 'Closed',true);
    % find a bounding rect for polygon
    boundRect{i} = cv.boundingRect(contours{i});
    % find a minimum enclosing circle for polygon
    [center{i}, radius(i)] = cv.minEnclosingCircle(contours{i});
end
Draw
Draw polygonal contour + bonding rects + circles
drawing = zeros([size(threshold_output) 3], 'uint8');
for i=1:numel(contours)
    % pick a random color
    color = randi([0 255], [1 3]);
    % draw the contour
    drawing = cv.drawContours(drawing, contours_poly, ...
        'ContourIdx',i-1, 'MaxLevel',0, 'Hierarchy',hierarchy, ...
        'Color',color, 'Thickness',1, 'LineType',8);
    % draw the bounding rectangle
    drawing = cv.rectangle(drawing, boundRect{i}, ...
        'Color',color, 'Thickness',2, 'LineType',8);
    % draw the minimal enclosing circle
    drawing = cv.circle(drawing, center{i}, radius(i), ...
        'Color',color, 'Thickness',2, 'LineType',8);
end

% Show in a figure
imshow(drawing), title('Contours')
