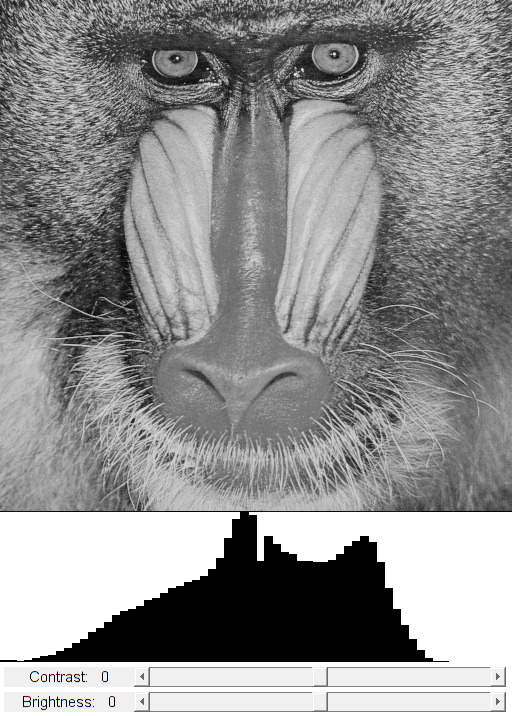
Intensity Image Histogram
This program demonstrates the use of cv.calcHist for histogram creation.
Sources:
function varargout = hist_demo_gui(im)
    % load source image
    if nargin < 1
        im = fullfile(mexopencv.root(),'test','img001.jpg');
        src = cv.imread(im, 'Grayscale',true);
    elseif ischar(im)
        src = cv.imread(im, 'Grayscale',true);
    else
        src = im;
    end
    % we expect a grayscale image
    if size(src,3) == 3, src = cv.cvtColor(src, 'RGB2GRAY'); end

    % create the UI
    h = buildGUI(src);
    if nargout > 0, varargout{1} = h; end
end

function onChange(~,~,h)
    %ONCHANGE  Event handler for UI controls

    % retrieve current values from UI controls
    histSize = 64;
    brightness = round(get(h.slid(1), 'Value'));
    contrast = round(get(h.slid(2), 'Value'));
    set(h.txt(1), 'String',sprintf('Brightness: %3d',brightness));
    set(h.txt(2), 'String',sprintf('Contrast: %3d',contrast));

    % brightness/contrast adjusted image
    % algorithm by Werner D. Streidt
    % <http://visca.com/ffactory/archives/5-99/msg00021.html>
    if contrast > 0
        delta = 127 * contrast/100;
        a = 255 / (255 - delta*2);
        b = a * (brightness - delta);
    else
        delta = -128 * contrast/100;
        a = (256 - delta*2) / 255;
        b = a * brightness + delta;
    end
    dst = uint8(double(h.src) * a + b);

    % calculate 1D histogram of grayscale image
    if true
        histo = cv.calcHist(dst, [0 256], 'HistSize',histSize, 'Uniform',true);
    else
        histo = cv.calcHist(dst, linspace(0,256,histSize+1));
    end
    histo = cv.normalize(histo, 'NormType','MinMax', ...
        'Alpha',0, 'Beta',h.hsz(1), 'DType','single');

    % draw histogram bars
    out = ones(h.hsz, 'uint8') * 255;
    binW = round(h.hsz(2) / histSize);  % width of bin bars
    for i=1:histSize
        out = cv.rectangle(out, ...
            round([(i-1)*binW, h.hsz(1)]), ...
            round([i*binW, h.hsz(1)-histo(i)]), ...
            'Color',0, 'Thickness','Filled');
    end

    % show results
    set(h.img(1), 'CData',out);
    set(h.img(2), 'CData',dst);
    drawnow;
end

function h = buildGUI(img)
    %BUILDGUI  Creates the UI

    % parameters
    brightness = 0;
    contrast = 0;
    sz = size(img);
    sz(2) = max(sz(2), 320);  % minimum figure width

    hsz = [150 sz(2)];  % size [h,w] of histogram output image
    out = ones(hsz, 'uint8') * 255;

    % build the user interface (no resizing to keep it simple)
    h = struct();
    h.src = img;
    h.hsz = hsz;
    h.fig = figure('Name','Histogram', ...
        'NumberTitle','off', 'Menubar','none', 'Resize','off', ...
        'Position',[200 200 sz(2) sz(1)+hsz(1)+55-1]);
    if ~mexopencv.isOctave()
        %HACK: not implemented in Octave
        movegui(h.fig, 'center');
    end
    h.ax(1) = axes('Parent',h.fig, ...
        'Units','pixels', 'Position',[1 55 sz(2) hsz(1)]);
    h.ax(2) = axes('Parent',h.fig, ...
        'Units','pixels', 'Position',[1 hsz(1)+55 sz(2) sz(1)]);
    if ~mexopencv.isOctave()
        h.img(1) = imshow(out, 'Parent',h.ax(1));
        h.img(2) = imshow(img, 'Parent',h.ax(2));
    else
        %HACK: https://savannah.gnu.org/bugs/index.php?45473
        axes(h.ax(1));
        h.img(1) = imshow(out);
        axes(h.ax(2));
        h.img(2) = imshow(img);
    end
    h.txt(1) = uicontrol('Parent',h.fig, 'Style','text', ...
        'Position',[5 5 130 20], 'FontSize',11, ...
        'String',sprintf('Brightness: %3d',brightness));
    h.txt(2) = uicontrol('Parent',h.fig, 'Style','text', ...
        'Position',[5 30 130 20], 'FontSize',11, ...
        'String',sprintf('Contrast: %3d',contrast));
    h.slid(1) = uicontrol('Parent',h.fig, 'Style','slider', ...
        'Position',[135 5 sz(2)-135-5 20], 'Value',brightness, ...
        'Min',-100, 'Max',100, 'SliderStep',[1 10]./200);
    h.slid(2) = uicontrol('Parent',h.fig, 'Style','slider', ...
        'Position',[135 30 sz(2)-135-5 20], 'Value',contrast, ...
        'Min',-100, 'Max',100, 'SliderStep',[1 10]./200);

    % hook event handlers
    set(h.slid, 'Callback',{@onChange,h}, ...
        'Interruptible','off', 'BusyAction','cancel');
    onChange([],[],h);
end
