Lucas-Kanade Tracker
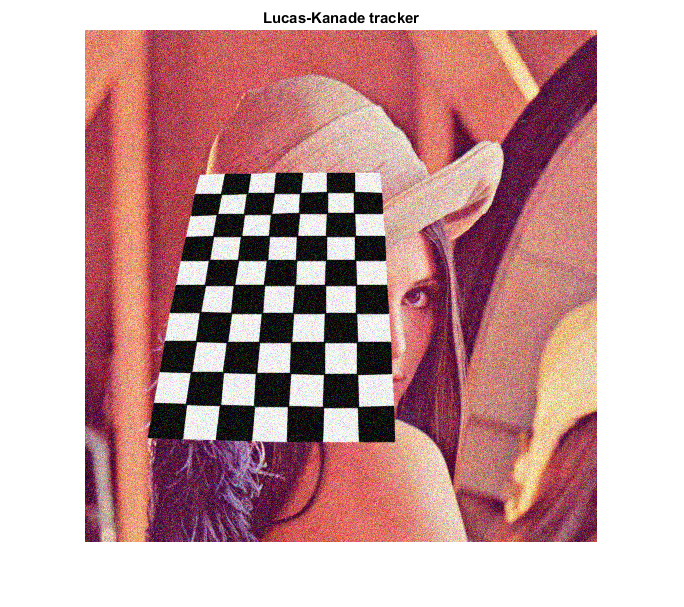
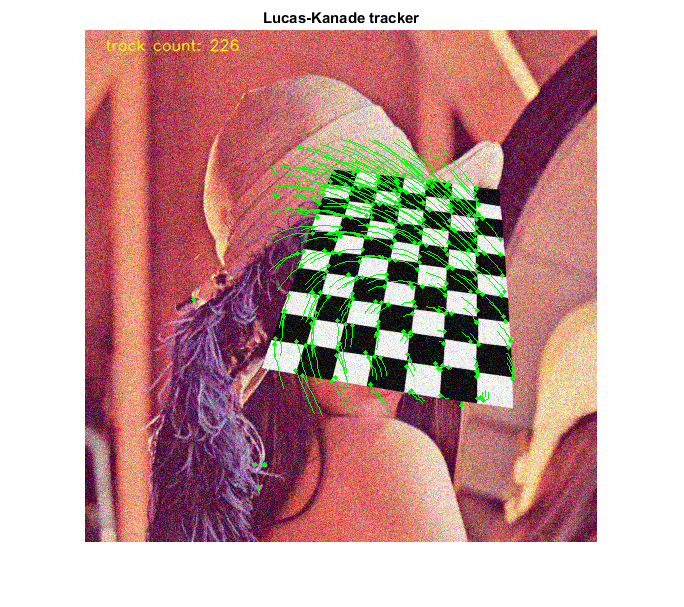
Lucas-Kanade sparse optical flow demo. Uses cv.goodFeaturesToTrack for track initialization and back-tracking for match verification between frames.
Sources:
Contents
Options
track_len = 10;       % max number of locations of point to remember
detect_interval = 5;  % detect new corners every X iterations

% params for corner detection and flow computation
shi_params = {'MaxCorners',500, 'QualityLevel',0.3, 'MinDistance',7, ...
    'BlockSize',7};
lk_params = {'WinSize',[15 15], 'MaxLevel',2, ...
    'Criteria',struct('type','Count+EPS', 'maxCount',10, 'epsilon',0.03)};
Video
Prepare video source
if true
    vid = 0;
elseif true
    vid = fullfile(mexopencv.root(), 'test', '768x576.avi');
elseif mexopencv.require('vision')
    vid = fullfile(toolboxdir('vision'), 'visiondata', 'visiontraffic.avi');
end
cap = createVideoCapture([], 'chess');
assert(cap.isOpened(), 'Failed to initialize capturing');
First frame
Grab first frame
frame = cap.read();
assert(~isempty(frame), 'Failed to read frame');
gray0 = cv.cvtColor(frame, 'RGB2GRAY');
Initialize
stores history of locations for a set of points (cell array of Nx2 matrices)
tracks = {};
clr = [0 255 0];
Plot
hImg = imshow(frame);
title('Lucas-Kanade tracker')
Main loop
counter = 0;  % iterations counter
while ishghandle(hImg)
    % Grab next frame
    frame = cap.read();
    if isempty(frame), break; end
    gray1 = cv.cvtColor(frame, 'RGB2GRAY');

    if ~isempty(tracks)
        % track last position of points, in forward and backward direction
        p0 = cellfun(@(tr) tr(end,:), tracks, 'UniformOutput',false);
        p1 = cv.calcOpticalFlowPyrLK(gray0, gray1, p0, lk_params{:});
        p0r = cv.calcOpticalFlowPyrLK(gray1, gray0, p1, lk_params{:});
        % keep only good matches
        good = cellfun(@(a,b) max(abs(a - b)), p0, p0r) < 1;
        tracks = tracks(good);
        p1 = p1(good);
        if any(good)
            % append new locations to existing tracked points
            tracks = cellfun(@(tr,p) [tr; p], tracks, p1, 'UniformOutput',false);
            % keep only the last 10 locations in each track (fixed size queue)
            idx = cellfun(@(tr) size(tr,1), tracks) > track_len;
            tracks(idx) = cellfun(@(tr) tr(2:end,:), tracks(idx), 'UniformOutput',false);
            % draw latest points and their tracks (comet-like plot)
            frame = cv.circle(frame, p1, 2, 'Thickness','Filled', 'Color',clr);
            frame = cv.polylines(frame, tracks, 'Closed',false, 'Color',clr);
        end
    end

    % display number of tracked points
    frame = cv.putText(frame, ...
        sprintf('track count: %d', numel(tracks)), [20 20], ...
        'FontScale',0.5, 'Color',[255 255 0], 'LineType','AA');

    if rem(counter, detect_interval) == 0 || isempty(tracks)
        % region of interest mask
        if ~isempty(tracks)
            % try to find new points by masking-out last track positions
            mask = 255 * ones(size(gray1), 'uint8');
            p = cellfun(@(tr) tr(end,:), tracks, 'UniformOutput',false);
            mask = cv.circle(mask, p, 5, 'Thickness','Filled', 'Color',0);
            roi_params = {'Mask',mask};
        else
            roi_params = {};
        end
        % detect corners
        p = cv.goodFeaturesToTrack(gray1, roi_params{:}, shi_params{:});
        if ~isempty(p)
            % append new set of points (p is a cell array of 1x2 vectors)
            tracks = [tracks, p];
        end
    end

    % Display result
    set(hImg, 'CData',frame);
    drawnow;

    % Next iteration
    counter = counter + 1;
    gray0 = gray1;
end
cap.release();
