Contents
Dense Optical Flow
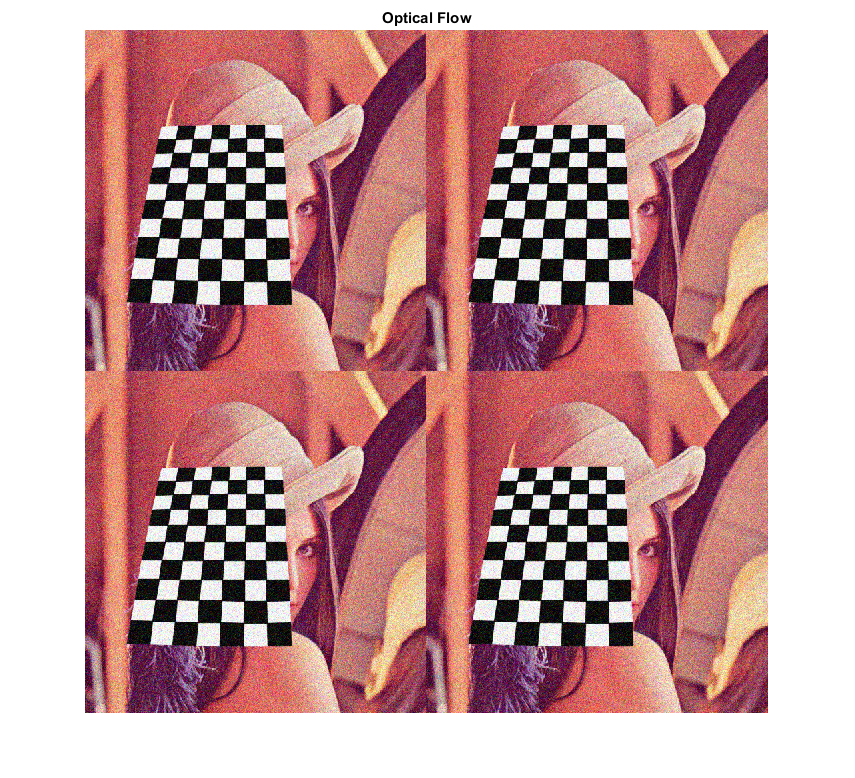
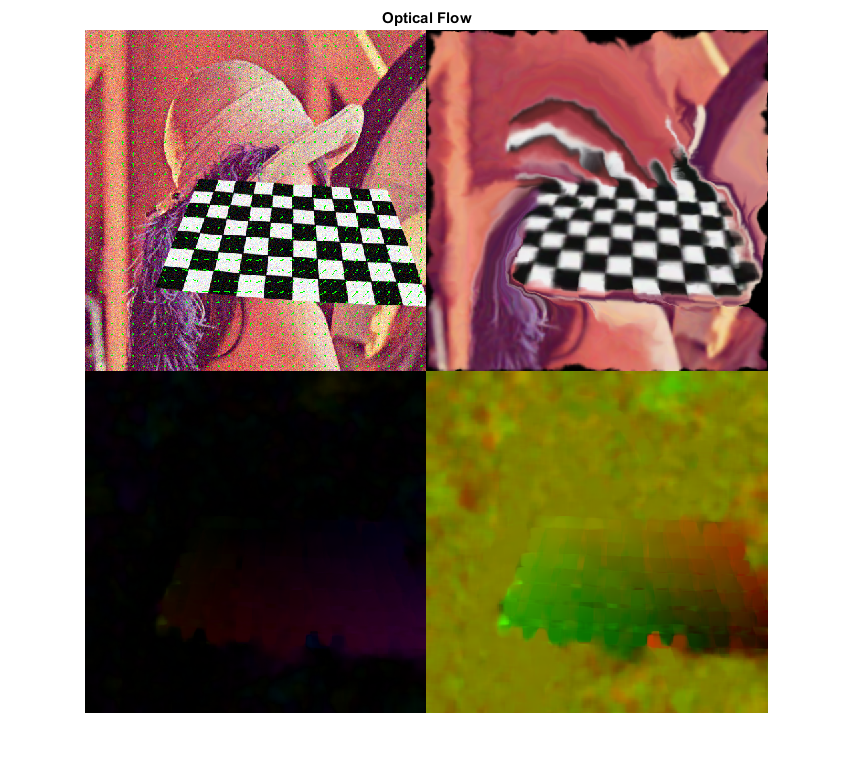
Demo shows how to compute the optical flow for all the points in the frame using cv.calcOpticalFlowFarneback.
OpenCV provides an algorithm to find the dense optical flow. It is based on Gunner Farneback's algorithm which is explained in "Two-Frame Motion Estimation Based on Polynomial Expansion" by Gunner Farneback in 2003.
Sources:
function opt_flow_demo()
    % Prepare video source
    if true
        vid = 0;
    elseif mexopencv.require('vision')
        vid = fullfile(toolboxdir('vision'), 'visiondata', 'visiontraffic.avi');
        %cap.PosFrames = 80;  % skip first few seconds with no motion
    else
        vid = fullfile(mexopencv.root(), 'test', '768x576.avi');
    end
    cap = createVideoCapture([], 'chess');
    assert(cap.isOpened(), 'Could not initialize capturing');

    % Grab first frame
    frame = cap.read();
    assert(~isempty(frame), 'Failed to read frame');
    prev = cv.cvtColor(frame, 'RGB2GRAY');
    outGlitch = [];

    % Plot
    hImg = imshow(repmat(frame, [2 2]));
    title('Optical Flow')

    % Main loop
    while ishghandle(hImg)
        % Grab next frame
        frame = cap.read();
        if isempty(frame), break; end
        next = cv.cvtColor(frame, 'RGB2GRAY');
        if isempty(outGlitch), outGlitch = frame; end

        % Calculate dense optical flow
        flow = cv.calcOpticalFlowFarneback(prev, next, ...
            'Levels',3, 'WinSize',15, 'Iterations',3, 'PolySigma',1.2);

        % Visualize optical flow
        outField = draw_vector_field(frame, flow);
        outGlitch = warp_flow(outGlitch, flow);
        outFlow1 = draw_flow_hsv(flow);
        outFlow2 = draw_flow_rgb(flow);

        % Display concatenated results
        set(hImg, 'CData',[outField, outGlitch; outFlow1, outFlow2]);
        drawnow;

        % Next iteration
        prev = next;
    end
    cap.release();
end
Warning: Image is too big to fit on screen; displaying at 67%

Helper functions
function img = draw_vector_field(img, flow, step, clr)
    %DRAW_FLOW  Vector field flow visualization

    if nargin < 3, step = 2^4; end
    if nargin < 4, clr = [0 255 0]; end

    % vector field grid
    sz = size(flow);
    if true
        xstep = step/2:step:sz(2);
        ystep = step/2:step:sz(1);
    else
        xstep = round(linspace(1, sz(2), 40));
        ystep = round(linspace(1, sz(1), 40));
    end
    [X,Y] = meshgrid(xstep, ystep);

    % draw arrows (velocity vectors)
    %TODO: cv.arrowedLine
    if true
        % vectorized implementation
        XY = [X(:) Y(:)];
        UV = reshape(permute(flow(ystep,xstep,:), [3 1 2]), 2, []).';
        img = cv.circle(img, XY, 1, 'Color',clr, 'Thickness','Filled');
        img = cv.line(img, XY, round(XY+UV), 'Color',clr);
    else
        % double-loops, much slower
        for x=xstep
            for y=ystep
                xy = [x y];
                uv = [flow(y,x,1) flow(y,x,2)];
                img = cv.circle(img, xy, 1, 'Color',clr, 'Thickness','Filled');
                img = cv.line(img, xy, round(xy+uv), 'Color',clr);
            end
        end
    end
end

function img = draw_flow_hsv(flow)
    %DRAW_FLOW_HSV  Flow visualization using HSV colorspace

    % map its direction to Hue value, and its magnitude to Value plane
    [ang, mag] = cart2pol(flow(:,:,1), flow(:,:,2)); % ang in [-pi,pi]
    if mexopencv.isOctave()
        %HACK: RAD2DEG not implemented in Octave
        ang = (ang + pi) * (180 / pi);
    else
        ang = rad2deg(ang + pi);
    end

    % create HSV image for flow visualization
    % (8-bit: 0 <= H <= 360/2, 0 <= S,V <= 255)
    img = zeros([size(flow,1) size(flow,2) 3], 'uint8');
    img(:,:,1) = ang / 2;
    img(:,:,2) = 255;
    if true
        img(:,:,3) = min(mag*4, 255);
    else
        img(:,:,3) = cv.normalize(mag, ...
            'NormType','MinMax', 'Alpha',0, 'Beta',255);
    end

    % convert to RGB image
    img = cv.cvtColor(img, 'HSV2RGB');
end

function img = draw_flow_hsv_(flow)
    %DRAW_FLOW_HSV_  Flow visualization using HSV colorspace

    [mag, ang] = cv.cartToPolar(flow(:,:,1), -flow(:,:,2), 'Degrees',true);
    mag = cv.normalize(mag, 'Alpha',0, 'Beta',1, 'NormType','MinMax');
    hsv = cat(3, ang, mag);
    hsv(:,:,3) = 1;
    img = cv.cvtColor(hsv, 'HSV2RGB');
    img = uint8(255 * img);
end

function img = draw_flow_rgb(flow)
    %DRAW_FLOW_RGB  Flow visualization using RGB colorspace

    dMax = max(abs(flow(:)));                  % max displacement
    img = bsxfun(@times, flow, cat(3,1,-1));   % U, -V
    img = (img - (-dMax)) / (dMax - (-dMax));  % map values
    img(:,:,3) = 0;
    img = uint8(255 * img);
end

function img = warp_flow(img, flow)
    %WARP_FLOW  Flow glitch

    flow = -flow;
    flow(:,:,1) = bsxfun(@plus, flow(:,:,1), 0:size(flow,2)-1);
    flow(:,:,2) = bsxfun(@plus, flow(:,:,2), (0:size(flow,1)-1).');
    img = cv.remap(img, flow, 'Interpolation','Area');
end
