Contents
Planar augmented reality
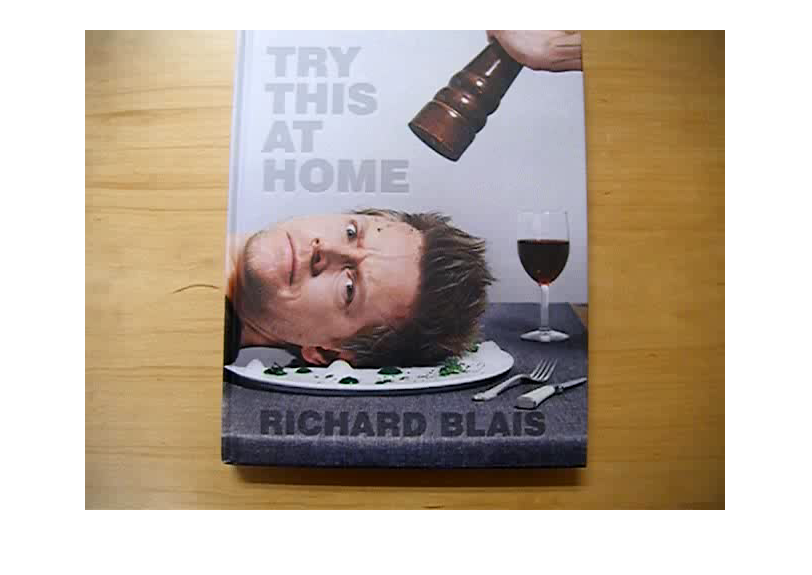
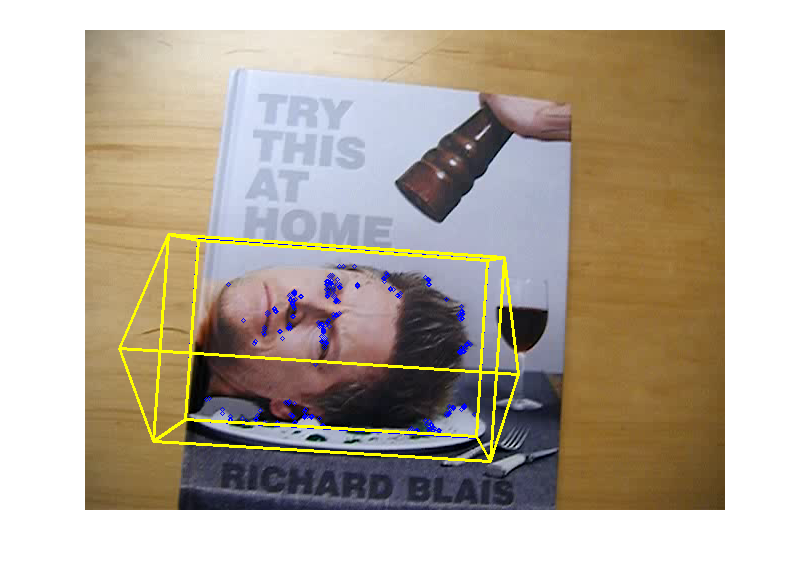
This sample shows an example of augmented reality overlay over a tracked planar object. The function cv.solvePnP is used to estimate the tracked object location in 3D space.
Select a textured planar object to track by drawing a box with the mouse. It uses the RectSelector and PlaneTracker classes.
Sample video: http://www.youtube.com/watch?v=pzVbhxx6aog.
Sources:
function plane_ar_demo(vid)
    % video file, and a default target to track [x,y,w,h]
    win = [];
    if nargin < 1
        vid = fullfile(mexopencv.root(), 'test', 'blais.mp4');
        assert(exist(vid, 'file') == 2, 'Missing video file');
        if true
            win = [135 165 285 175];  % face
        else
            win = [136 0 366 433];    % book
        end
    elseif isempty(vid)
        vid = 0;
    end

    % open video feed, and get first frame
    cap = cv.VideoCapture(vid);
    pause(1);
    assert(cap.isOpened(), 'Failed to open video');
    frame = cap.read();
    assert(~isempty(frame), 'Failed to read frames');

    % prepare plot
    paused = false;
    hImg = imshow(frame);

    % create and initialize tracker
    tracker = PlaneTracker();
    if ~isempty(win)
        tracker.addTarget(frame, win);
    end

    % create ROI region selector
    if ~mexopencv.isOctave()
        onHelp();
        roi = RectSelector(hImg);
        roi.callback = @onRect;
    else
        %HACK: RectSelector not Octave compatible
        %HACK: function handle to nested function not supported in Octave
        roi = struct('isDragging',@()false);
    end

    % listen to keyboard input
    if ~mexopencv.isOctave()
        %HACK: function handle to nested function not supported in Octave
        set(ancestor(hImg,'figure'), 'WindowKeyPressFcn',@onType);
    end

    % main loop
    while ishghandle(hImg)
        playing = ~paused && ~roi.isDragging();
        if playing
            % read new frame
            frame = cap.read();
            if isempty(frame), break; end
        end
        out = frame;

        % track and draw keypoints, boundary, and pose of targets
        if playing
            tracked = tracker.track(frame);
            for i=1:numel(tracked)
                tr = tracked(i);
                out = cv.circle(out, tr.pt1, 2, 'Color',[0 0 255]);
                out = cv.polylines(out, tr.quad, 'Closed',true, ...
                    'Color',[0 0 255], 'Thickness',2);
                out = drawOverlay(out, tr);
            end
        end

        % display result
        set(hImg, 'CData',out);
        if playing
            drawnow;
        else
            pause(0.1);  % slow down a bit if paused
        end
    end
    cap.release();
    if isobject(roi), delete(roi); end

    % --- Callback functions ---

    function onRect(rect)
        %ONRECT  Callback for ROI selector
        %
        %     onRect(rect)
        %
        % ## Input
        % * __rect__ selected rectangle [x,y,w,h], or empty
        %

        if isempty(rect), return; end

        % track new target
        disp('Adding target...')
        tracker.addTarget(frame, rect);

        % un-pause
        paused = false;
    end

    function onType(hfig, e)
        %ONTYPE  Event handler for key press on figure

        switch e.Key
            case {'q', 'escape'}
                close(hfig);

            case 'h'
                onHelp();

            case {'space', 'p'}
                disp('Toggle pause...');
                paused = ~paused;

            case {'c', 'r'}
                disp('Clearing tracker...');
                tracker.clear();
        end
    end

    function onHelp()
        %ONHELP  Display usage help dialog

        h = helpdlg({
            'Select object(s) to track using the mouse.'
            'Hot keys:'
            '  q - quit'
            '  h - help'
            '  p - pause'
            '  c - clear targets'
        });

        % wait for user to accept dialog
        set(h, 'WindowStyle','modal');
        waitfor(h);
    end
end

Helper function
function img = drawOverlay(img, tr)
    %DRAWOVERLAY  Draw a 3D house on top of tracked object to show its pose
    %
    %     img = drawOverlay(img, tr)
    %
    % ## Input
    % * __img__ image on which to draw
    % * __tr__ tracked target structure
    %
    % ## Output
    % * __img__ output image
    %

    if true
        % simple model of a house (cube with a triangular prism roof)
        ar_vertices = [
            0 0 0; 0 1 0; 1 1 0; 1 0 0; ...
            0 0 1; 0 1 1; 1 1 1; 1 0 1; ...
            0 0.5 2; 1 0.5 2
        ];
        ar_edges = [
            0 1; 1 2; 2 3; 3 0; ...
            4 5; 5 6; 6 7; 7 4; ...
            0 4; 1 5; 2 6; 3 7; ...
            4 8; 5 8; 6 9; 7 9; 8 9
        ];
    else
        % simple XYZ axes
        ar_vertices = [0 0 0; 1 0 0; 0 1 0; 0 0 1];
        ar_edges = [0 1; 0 2; 0 3];
    end

    % camera matrix (assumes planar tracked object wrt camera plane)
    [h,w,~] = size(img);
    fx = 1.0;  % adjust camera focal length for proper augmentation [0.5, 1.0]
    K = [fx*w,    0, 0.5*(w-1); ...
            0, fx*w, 0.5*(h-1); ...
            0,    0,         1];

    % find object pose from corresponding 3D/2D points
    rect = tr.target.rect;
    quad_3d = rect([1 2; 3 2; 3 4; 1 4]);
    quad_3d(:,3) = 0;  % Z=0 for 3D points in target image
    [rvec, tvec] = cv.solvePnP(quad_3d, tr.quad, K);

    % scale and translate house vertices, to place it on top of target object
    % in target image coordinates, with origin being top-left corner in
    % rectangle plane:
    %  1 unit in x-dir = object width
    %  1 unit in y-dir = object height
    %  1 unit in z-dir = 0.3 * object width (in opposite cam z-direction)
    xyzScale = rect(3:4) - rect(1:2);
    xyzScale(3) = -0.3 * max(xyzScale);
    verts = bsxfun(@times, ar_vertices, xyzScale);
    verts = bsxfun(@plus, verts, [rect(1:2) 0]);

    % project house 3d points to 2d points in new frame coordinates
    verts = cv.projectPoints(verts, rvec, tvec, K);

    % connect and draw house edges in new frame
    pts1 = verts(ar_edges(:,1)+1,:);
    pts2 = verts(ar_edges(:,2)+1,:);
    img = cv.line(img, pts1, pts2, 'Color',[255 255 0], 'Thickness',2);
end
