Contents
OCR of hand-written digits using HoG and SVM
In this tutorial, we will build an SVM classifer to recognize hand-written digits (0 to 9), using Histogram of Oriented Gradients (HOG) as feature vectors.
For additional resources, see this HoG video lecture.
Sources:
function svm_hog_ocr_digits_demo()Data
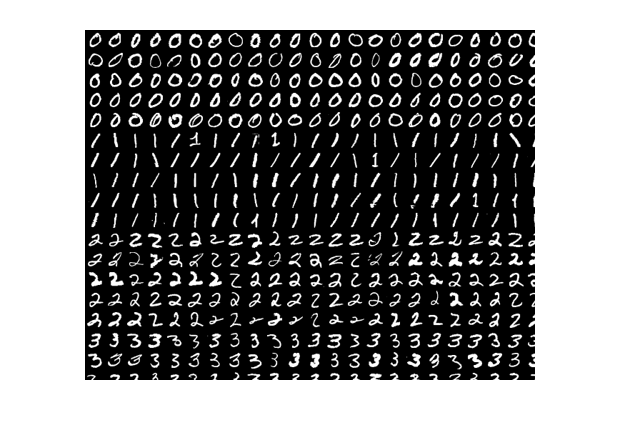
Load MNIST handwritten digits (5000 images) (params in this demo are hardcoded assuming 20x20 images)
    [imgs, labels, img] = load_mnist_digits();
    assert(numel(imgs)==5000 && isequal(size(imgs{1}),[20 20]));
Show a portion of the big image
    imshow(img(1:350,1:450))
    %imtool(img)
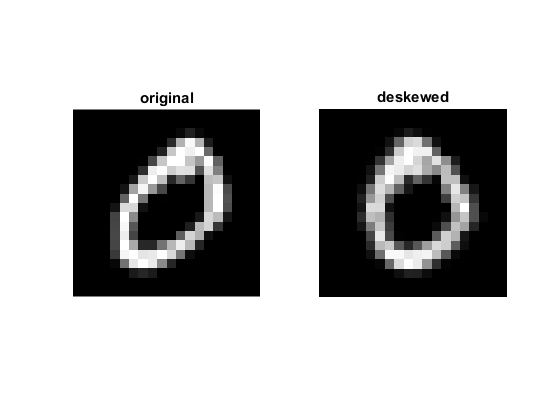
Show a sample of an image before and after deskew is applied
    figure
    subplot(121), imshow(imgs{1}), title('original')
    subplot(122), imshow(deskew(imgs{1})), title('deskewed')
HoG
choose an HoG implementation to use: OpenCV, MATLAB, or a simple custom one
    HOG_ALG = 'opencv';
    HOG_ALG = validatestring(HOG_ALG, {'custom', 'matlab', 'opencv'});
HoG features are stored in a matrix, one row per image
    switch HOG_ALG
        case 'custom'
            nbins = 16;          % number of bins to quantize gradient angles
            nfeats = 4 * nbins;  % feature length
        case 'matlab'
            opts = {'CellSize',[10 10], 'BlockSize',[2 2], ...
                'NumBins',9, 'UseSignedOrientation',true};
            nfeats = numel(extractHOGFeatures(imgs{1}, opts{:}));
        case 'opencv'
            % create HOG object
            opts = {'WinSize',[20 20], 'BlockSize',[10 10], ...
                'BlockStride',[5 5], 'CellSize',[10 10], ...
                'NBins',9, 'SignedGradient',true};
            %opts = [opts, 'GammaCorrection',false];
            hog = cv.HOGDescriptor(opts{:});
            nfeats = numel(hog.compute(imgs{1}));
            display(hog)
    end
    descs = zeros(numel(imgs), nfeats, 'single');
hog =
  HOGDescriptor with properties:

                   id: 4
              WinSize: [20 20]
            BlockSize: [10 10]
          BlockStride: [5 5]
             CellSize: [10 10]
                NBins: 9
        DerivAperture: 1
             WinSigma: -1
    HistogramNormType: 'L2Hys'
       L2HysThreshold: 0.2000
      GammaCorrection: 0
              NLevels: 64
       SignedGradient: 1
          SvmDetector: [1×0 single]
Process images and compute HOG descriptors for each
    tic
    disp('Extracting...')
    for i=1:numel(imgs)
        % deskew image
        img = deskew(imgs{i});
        %img = cv.threshold(img, 'Otsu');

        % compute HOG descriptors flattened as a vector
        switch HOG_ALG
            case 'custom'
                descs(i,:) = my_hog(img, nbins);
            case 'matlab'
                descs(i,:) = extractHOGFeatures(img, opts{:});
            case 'opencv'
                d = hog.compute(img).'; % returns a matrix, one row per window
                descs(i,:) = d(:);
        end
    end
    toc
Extracting... Elapsed time is 3.625383 seconds.
Classification
Create multi-class linear SVM classifier
    svm = cv.SVM();
    svm.Type = 'C_SVC';
    svm.KernelType = 'Linear';
    svm.C = 0.5;  % or do a trainAuto grid search to find optimal C
    display(svm)
svm =
SVM with properties:
id: 6
Type: 'C_SVC'
KernelType: 'Linear'
Degree: 0
Gamma: 1
Coef0: 0
C: 0.5000
Nu: 0
P: 0
ClassWeights: []
TermCriteria: [1×1 struct]
split data samples and corresponding labels
    labels = int32(labels(:));
    N = 2500;  % fix(numel(labels)/2)
    whos descs labels
    if ~mexopencv.isOctave() && mexopencv.require('stats')
        % train/test split
        tabulate(labels(1:N))
        tabulate(labels(N+1:end))
    end
Name Size Bytes Class Attributes
descs 5000x81 1620000 single
labels 5000x1 20000 int32
Value Count Percent
0 250 10.00%
1 250 10.00%
2 250 10.00%
3 250 10.00%
4 250 10.00%
5 250 10.00%
6 250 10.00%
7 250 10.00%
8 250 10.00%
9 250 10.00%
Value Count Percent
0 250 10.00%
1 250 10.00%
2 250 10.00%
3 250 10.00%
4 250 10.00%
5 250 10.00%
6 250 10.00%
7 250 10.00%
8 250 10.00%
9 250 10.00%
use half as training data
    tic
    disp('Training...')
    svm.train(descs(1:N,:), labels(1:N));
    toc
Training... Elapsed time is 0.088898 seconds.
the other half for testing
    tic
    disp('Testing...')
    yhat = svm.predict(descs(N+1:end,:));
    toc
    %TODO: https://savannah.gnu.org/bugs/?50716
Testing... Elapsed time is 0.006316 seconds.
performance on test set
    acc = nnz(yhat == labels(N+1:end));
    confmat = accumarray([labels(N+1:end), yhat]+1, 1);
    display(confmat)
    fprintf('Accuracy = %f%%\n', (acc/N)*100);
confmat =
249 0 0 0 0 0 1 0 0 0
0 246 1 1 0 0 0 2 0 0
0 1 236 8 1 0 0 4 0 0
0 0 0 242 0 0 0 5 2 1
0 0 0 0 245 0 0 0 0 5
0 0 0 0 0 249 0 0 1 0
0 0 1 0 0 0 249 0 0 0
0 1 5 1 0 0 0 239 2 2
0 1 1 1 0 2 2 0 241 2
0 1 0 0 0 1 0 8 0 240
Accuracy = 97.440000%
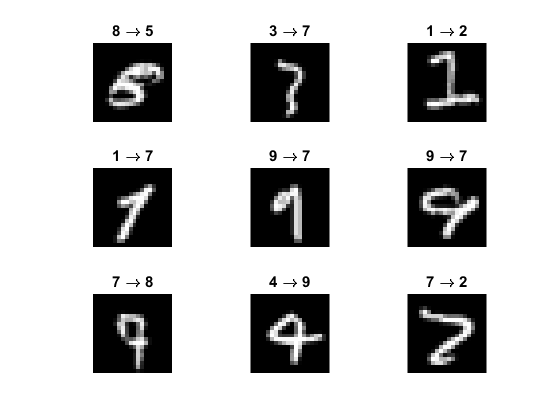
Show some of the wrong predictions
    idx = (yhat ~= labels(N+1:end));
    fprintf('Number of wrong predictions = %d / %d\n', nnz(idx), N);
    figure
    idx = find(idx, 3*3, 'first');
    for i=1:numel(idx)
        ii = idx(i);
        subplot(3,3,i), imshow(imgs{ii+N})
        title(sprintf('%d \\rightarrow %d', labels(ii+N), yhat(ii)))
    end
Number of wrong predictions = 64 / 2500

endHelper functions
function [imgs, labels, img] = load_mnist_digits()
    % Load MNIST handwritten digits, one big image
    fname = fullfile(mexopencv.root(), 'test', 'digits.png');
    if exist(fname, 'file') ~= 2
        disp('Downloading image...')
        url = 'https://cdn.rawgit.com/opencv/opencv/3.2.0/samples/data/digits.png';
        urlwrite(url, fname);
    end
    img = cv.imread(fname, 'Grayscale',true);

    % split it into 5000 small images (500 from each 0:9 digits),
    % each image is 20x20 pixels
    [h,w] = size(img);
    imgs = mat2cell(img, ones(1,50)*h/50, ones(1,100)*w/100);
    imgs = reshape(imgs', 500, [])';  % cell array of size 10x500
    labels = repmat((0:9)', 1, 500);  % each row is one digit
end

function img = deskew(img)
    % deskew image using its second order moments
    sz = 20;
    m = cv.moments(img);
    if abs(m.mu02) > 0.2  % 0.01
        skew = m.mu11 / m.mu02;
        M = [1 skew -0.5*sz*skew; 0 1 0];
        img = cv.warpAffine(img, M, 'DSize',[sz sz], 'WarpInverse',true);
    end
end

function histo = my_hog(img, nbins)
    % this is a simplified implementation of HoG descriptors
    % (fixed 10x10 cells, 1 block, no overlapping, no block normalization)

    % number of orientation histogram bins
    if nargin < 2, nbins = 16; end

    % compute image gradient (its magnitude and direction)
    gx = cv.Sobel(img, 'DDepth','single', 'XOrder',1, 'YOrder',0);
    gy = cv.Sobel(img, 'DDepth','single', 'XOrder',0, 'YOrder',1);
    mag = hypot(gx, gy);
    ang = atan2(gy, gx) + pi;  % directions in [0,2*pi] (signed gradient)

    % quantize directions into 16 bins
    bins = fix((nbins-1) * ang/(2*pi)) + 1; % bin indices in [1,16] inclusive

    % divide 20x20 image into 4 10x10 cells, and in each,
    % accumulate gradient magnitudes inside each direction bin
    % (binned orientations each weighted by its magnitude contribution)
    bb = mat2cell(bins, [10 10], [10 10]);
    mm = mat2cell(mag, [10 10], [10 10]);
    histo = cell(size(bb));
    for i=1:numel(bb)
        H = accumarray(bb{i}(:), mm{i}(:), [nbins 1]);
        if false && any(H)
            % transform histogram to space with Hellinger metric
            H = sqrt(H ./ sum(H));
            H = H ./ norm(H);
        end
        histo{i} = H;
    end

    % stack features from cells into one tall vector of length 4*16
    histo = cat(1, histo{:});
end