Plot demo
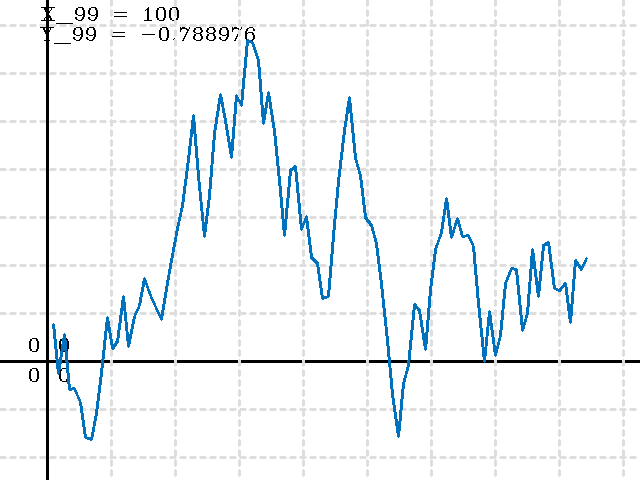
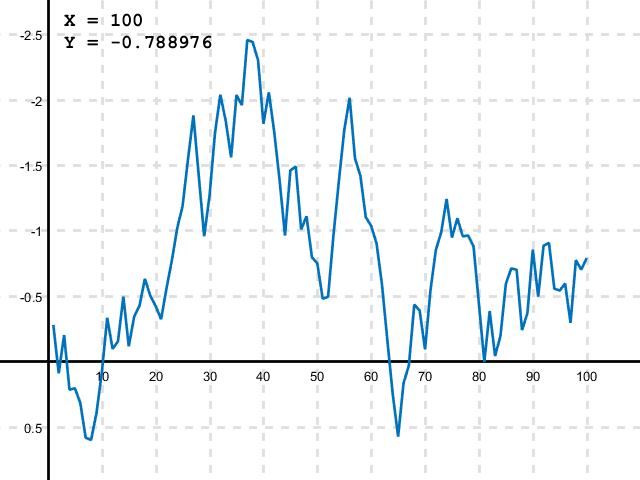
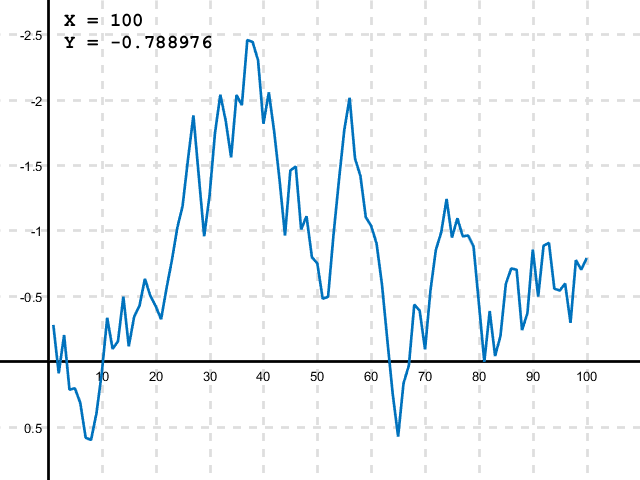
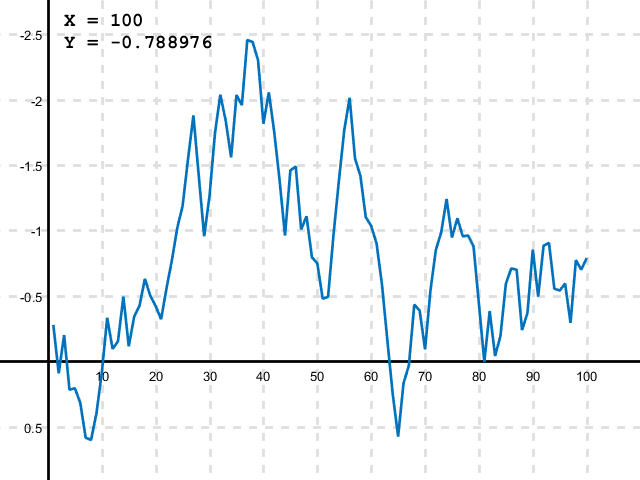
Demonstrates OpenCV and MATLAB plotting.
Contents
Data
try, rng(5); end  % fixed PRNG seed for reproducible results
y = cumsum(rand(100,1) - 0.5);
x = (1:numel(y)).';
assert(isvector(x) && isvector(y) && numel(x) == numel(y));
Options
sz = [640 480];  % [400 300] is the minimum
xl = [min(x) max(x)] + [-0.1 0.1]*(max(x) - min(x));
yl = [min(y) max(y)] + [-0.1 0.1]*(max(y) - min(y));
lw = 2;
ln = true;
lc = [0 114 189];
bg = [255 255 255];
fg = [0 0 0];
gc = [222 222 222];
OpenCV
p = cv.Plot2d(x, y);
p.PlotSize = sz;
p.MinX = xl(1);
p.MaxX = xl(2);
p.MinY = yl(1);
p.MaxY = yl(2);
p.PlotLineWidth = lw;
p.NeedPlotLine = ln;
p.PlotLineColor = lc;
p.PlotBackgroundColor = bg;
p.PlotAxisColor = fg;
p.PlotTextColor = fg;
p.PlotGridColor = gc;
img = p.render();
img = cv.cvtColor(img, 'BGR2RGB');
if ~mexopencv.isOctave()
    imshow(img, 'Border','tight', 'InitialMagnification',100)
else
    imshow(img)
end
set(gcf, 'Name','OpenCV')

fname = fullfile(tempdir(), 'plot_opencv.png');
cv.imwrite(fname, img);
disp(['Saved to: ' fname])
Saved to: C:\Users\Amro\AppData\Local\Temp\plot_opencv.png
MATLAB/Octave (HG1)
hFig = figure('Name','MATLAB', 'Position',[200 200 sz]);
hAx = axes();
hLine = line(x, y, 'LineWidth',lw, 'LineStyle','-', 'Color',lc/255);
if ~ln
    set(hLine, 'LineStyle','none', 'Marker','.', 'MarkerSize',12);
end
if ~mexopencv.isOctave()
    %HACK: some Octave graphics backends ignore axislocation=origin
    % also setting gridalpha turns grid lines black
    ax_props = {'Position',[0 0 1 1], 'GridAlpha',1.0};
else
    ax_props = {};
end
set(hAx, 'XLim',xl, 'YLim',yl, 'LineWidth',2, ...
    'Color',bg/255, 'XColor',fg/255, 'YColor',fg/255, ...
    'GridColor',gc/255, 'GridLineStyle','--', 'XGrid','on', 'YGrid','on', ...
    'Box','off', 'TickLength',[0 0], 'YDir','reverse', ...
    'XAxisLocation','origin', 'YAxisLocation','origin', ax_props{:});
if false
    set(hAx, 'XTickLabel', '', 'YTickLabel', '', 'FontSmoothing', 'off');
    set(hFig, 'GraphicsSmoothing', 'off');
end
text(0.1, 0.98, sprintf('X = %g\nY = %g\n', x(end), y(end)), ...
    'Units','normalized', 'Interpreter','none', 'Color',fg/255, ...
    'FontName','FixedWidth', 'FontSize',14, 'FontWeight','bold', ...
    'VerticalAlignment','top', 'HorizontalAlignment','left');

fname = fullfile(tempdir(), 'plot_matlab1.png');
print(hFig, fname, '-dpng', '-r0');
disp(['Saved to: ' fname]);
Saved to: C:\Users\Amro\AppData\Local\Temp\plot_matlab1.png

MATLAB (HG2)
if ~mexopencv.isOctave()
    hFig = figure('Name','MATLAB');
    hFig.Position(3:4) = sz;
    movegui(hFig, 'center');

    hAx = axes();
    hAx.Position = [0 0 1 1];

    hLine = line(x, y);
    hLine.LineWidth = lw;
    hLine.LineStyle = '-';
    if ~ln
        hLine.LineStyle = 'none';
        hLine.Marker = '.';
        hLine.MarkerSize = 12;
    end
    hLine.Color = lc/255;

    hAx.XLim = xl;
    hAx.YLim = yl;
    hAx.Color = bg/255;
    hAx.XColor = fg/255;
    hAx.YColor = fg/255;
    hAx.GridColor = gc/255;
    hAx.GridAlpha = 1.0;
    hAx.LineWidth = lw;
    hAx.GridLineStyle = '--';
    hAx.XGrid = 'on';
    hAx.YGrid = 'on';
    hAx.Box = 'off';
    hAx.TickLength = [0 0];
    hAx.XAxisLocation = 'origin';
    hAx.YAxisLocation = 'origin';
    hAx.YDir = 'reverse';
    if false
        hAx.XTickLabel = '';
        hAx.YTickLabel = '';
        hAx.FontSmoothing = 'off';
        hFig.GraphicsSmoothing = 'off';
    end

    hTxt = text(0.1, 0.98, '', 'Units','normalized');
    hTxt.String = sprintf('X = %g\nY = %g\n', x(end), y(end));
    hTxt.Interpreter = 'none';
    hTxt.Color = fg/255;
    hTxt.FontName = 'FixedWidth';
    hTxt.FontSize = 14;
    hTxt.FontWeight = 'bold';
    hTxt.VerticalAlignment = 'top';
    hTxt.HorizontalAlignment = 'left';

    % capture
    [im,map] = frame2im(getframe(hAx));
    if isempty(map)
        args = {im};
    else
        args = {im, map};
    end
    fname = fullfile(tempdir(), 'plot_matlab2.png');
    imwrite(args{:}, fname);
    disp(['Saved to: ' fname]);
end
Saved to: C:\Users\Amro\AppData\Local\Temp\plot_matlab2.png
